Data sources for cost analysis of drug development R&D and clinical trials
Cost estimates for pre-clinical and clinical development across the pharmaceutical industry differ based on several factors. One of these is the source of data used by each costing study to inform these estimates. Several studies use private data, which can include confidential surveys filled out by pharmaceutical firms/clinical trial units and random samples from private databases3,9,10,14,15,16. Other studies have based their cost estimates upon publicly available data, such as data from the FDA/national drug regulatory agencies, published peer-reviewed studies, and other online public databases1,2,12,13,17.
Some have questioned the validity of using private surveys from large multinational pharmaceutical companies to inform cost estimates, saying that survey data may be artificially inflated by pharmaceutical companies to justify high therapeutic prices 18,19,20. Another concern is that per trial spending by larger pharmaceutical companies and multinational firms would far exceed the spending of start-ups and smaller firms, meaning cost estimates made based on data from these larger companies would not be representative of smaller firms.
Failure rate of R&D and clinical trial pipelines
Many estimates include the cost of failures, which is especially the case for cost estimates “per approved drug”. As many compounds enter the clinical trial pipeline, the cost to develop one approved drug/compound includes cost of failures by considering the clinical trial success rate and cost of failed compounds. For example, if 100 compounds enter phase I trials, and 2 compounds are approved, the clinical cost per approved drug would include the amount spent on 50 compounds.
The rate of success used can massively impact cost estimates, where a low success rate or high failure rate will lead to much higher costs per approved drug. The overall probability of clinical success may vary by year and has been estimated at a range of values including 7.9%21, 11.83%10, and 13.8%22. There are concerns that some studies suggesting lower success rates have relied on small samples from industry curated databases and are thereby vulnerable to selection bias12,22.
Success rates per phase transition also affects overall costs. When more ultimately unsuccessful compounds enter late clinical trial stages, the higher the costs are per approved compound. In addition, success rates are also dependent on therapeutic area and patient stratification by biomarkers, among other factors. For example, one study estimated the lowest success rate at 1.6% for oncological trials without biomarker use compared with a peak success rate of 85.7% for cardiovascular trials utilising biomarkers22. While aggregate success rates can be used to estimate costs, using specific success rates will be more accurate to estimate the cost of a specific upcoming trial, which could help with budgeting and funding decisions.
Out-of-pocket costs vs capitalised costs & interest rates
Cost estimates also differ due to reporting of out-of-pocket and capitalised costs. An out-of-pocket cost refers to the amount of money spent or expensed on the R&D of a therapeutic. This can include all aspects of setting up therapeutic development, from initial funding in drug discovery/device design, to staff and site costs during clinical trials, and regulatory approval expenses.
The capitalised cost of a new therapeutic refers to the addition of out-of-pocket costs to a yearly interest rate applied to the financial investments funding the development of a new drug. This interest rate, referred to as the discount rate, is determined by (and is typically greater than) the cost of capital for the relevant industry.
Discount rates for the pharmaceutical industry vary between sources and can dramatically alter estimates for capitalised cost, where a higher discount rate will increase capitalised cost. Most studies place the private cost of capital for the pharmaceutical industry to be 8% or higher23,24, while the cost of capital for government is lower at around 3% to 7% for developed countries23,25. Other sources have suggested rates from as high as 13% to as low as zero13,23,26, where the zero cost of capital has been justified by the idea that pharmaceutical firms have no choice but to invest in R&D. However, the mathematical model used in many estimations for the cost of industry capital, the CAPM model, tends to give more conservative estimates23. This would mean the 10.5% discount rate widely used in capitalised cost estimates may in fact result in underestimation.
While there is not a consensus on what discount rate to use, capitalised costs do represent the risks undertaken by research firms and investors. A good approach may be to present both out-of-pocket and capitalised estimated costs, in addition to rates used, justification for the rate used, and the estimates using alternative rates in a sensitivity analysis26.
Costs variation over time
The increase in therapeutic development costs
Generally, there has been a significant increase in the estimated costs to develop a new therapeutic over time26. One study reported an exponential increase of capitalised costs from the 1970s to the mid-2010s, where the total capitalised costs rose annually 8.5% above general inflation from 1990 to 201310. Recent data has suggested that average development costs reached a peak in 2019 and had decreased the following two years9. This recent decrease in costs was associated with slightly reduced cycle times and an increased proportion of infectious disease research, likely in response to the rapid response needed for COVID-19.
Recent cost estimates
Costs can range with more than 100-fold differences for phase III/pivotal trials alone1. One of the more widely cited studies on drug costs used confidential survey data from ten multinational pharmaceutical firms and a random sample from a database of publicly available data10. In 2013, this study estimated the total pre-approval cost at $2.6 billion USD per approved new compound. This was a capitalised cost, and the addition of post-approval R&D costs increased this estimate to $2.87 billion (2013 USD). The out-of-pocket cost per approved new compound was reported at $1.395 billion, of which $965 million were clinical costs and the remaining $430 million were pre-clinical.
Another estimate reported the average cost to develop an asset at $1.296 billion in 20139. Furthermore, it reported that this cost had increased until 2019 at $2.431 billion and had since decreased to $2.376 billion in 2020 and $2.006 billion in 2021. While comparable to the previous out-of-pocket estimate for 2013, this study does not state whether their estimates are out-of-pocket or capitalised, making it difficult to meaningfully compare these estimates.
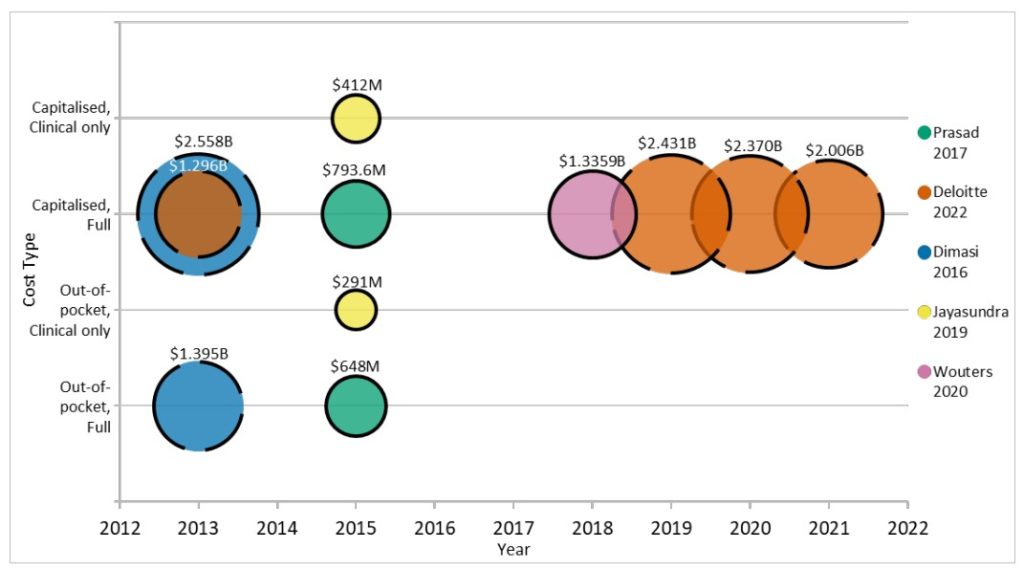
Publicly available data of 63 FDA-approved new biologics from 2009-2018 was used to estimate the capitalised (at 10.5%) R&D investment to bring a new drug to market at median of $985.3 million and a mean of $1.3359 billion (inflation adjusted to 2018 USD)12. These data were mostly accessible from smaller firms, smaller trials, first-in-class drugs, and further specific areas. The variation in estimated cost was, through sensitivity analysis, mostly explained by success/failure rates, preclinical expenditures, and cost of capital.
Publicly available data of 10 companies with no other drugs on the market in 2017 was used to estimate out-of-pocket costs for the development of a single cancer drug. This was reported at a median of $648 million and a mean of $719.8 million13. Capitalised costs were also reported using a 7% discount rate, with a median of $754.4 million and mean of $969.4 million. By focusing on data from companies without other drugs on the market, these estimates may better represent the development costs per new molecular entity (NME) for start-ups as the cost of failure of other drugs in the pipeline were included while any costs related to supporting existing on-market drugs were systematically impossible to include.
One study estimated the clinical costs per approved non-orphan drug at $291 million (out-of-pocket) and $412 million (capitalised 10.5%)17. The capitalised cost estimate increased to $489 million when only considering non-orphan NMEs. The difference between these estimates for clinical costs and the previously mentioned estimates for total development costs puts into perspective the amount
spent on pre-clinical trials and early drug development, with one studynoting their pre-clinical estimates comprised 32% of out-of-pocket and 42% of capitalised costs10.
Things to consider about cost estimates
The issue with these estimates is that there are so many differing factors affecting each study. This complicates cost-based pricing discussions, especially when R&D cost estimates can differ orders of magnitude apart. The methodologies used to calculate out-of-pocket costs differ between studies9,17, and the use of differing data sources (public data vs confidential surveys) seem to impact these estimates considerably.
There is also an issue with the transparency of data and methods from various sources in cost estimates. Some of this is a result of using confidential data, where some analyses are not available for public scrutiny8. This study in particular raised questions as estimates were stated without any information about the methodology or data used in the calculation of estimates. The use of confidential surveys of larger companies has also been criticised as the confidential data voluntarily submitted would have been submitted anonymously without independent verification12.
Due to the limited amount of comprehensive and published cost data17, many estimates have no option but to rely on using a limited data set and making some assumptions to arrive at a reasonable estimate. This includes a lack of transparent available data for randomised control trials, where one study reported that only 18% of FDA-approved drugs had publicly available cost data18. Therefore, there is a need for transparent and replicable data in this field to allow for more plausible cost estimates to be made, which in turn could be used to support budget planning and help trial sustainability18,26.
Despite the issues between studies, the findings within each study can be used to gather an idea of trends, cost drivers, and costs specific to company/drug types. For example, studies suggest an increasing overall cost of drug development from 1970 to peak in 201910, with a subsequent decrease in 2020 and 20219.
For a full list of references used in this article, please see the main report here: https://anatomisebiostats.com/biostatistics-blog/how-much-does-developing-a-novel-therapeutic-cost-factors-affecting-drug-development-costs-in-the-pharma-industry-a-mini-report/